The raising awareness concerning climate change and its risks has significantly reduced the amount of new coal or natural gas power plants being built. The global PV sector is growing at an increasingly rapid rate. Governments set ambitious renewable energy goals and favorable incentives to meet the national net-zero emission. However, the feed-in tariff (FiT) is getting lower as it seems to be various governments’ responses to the drop in the cost of the PV system. Given lower FiT, solar PV system developers are getting more and more concerned about the LCOE. The high penetration of PV plant also brings challenges to grid stability due to intermittent nature of solar radiation.
Given constant changes in terms of technologies, price and policies, this article will cite three typical projects implying three evolving periods of the PV sector and brings insights to the forecast of the industry.
Maximizing power generation without considering the grid stability

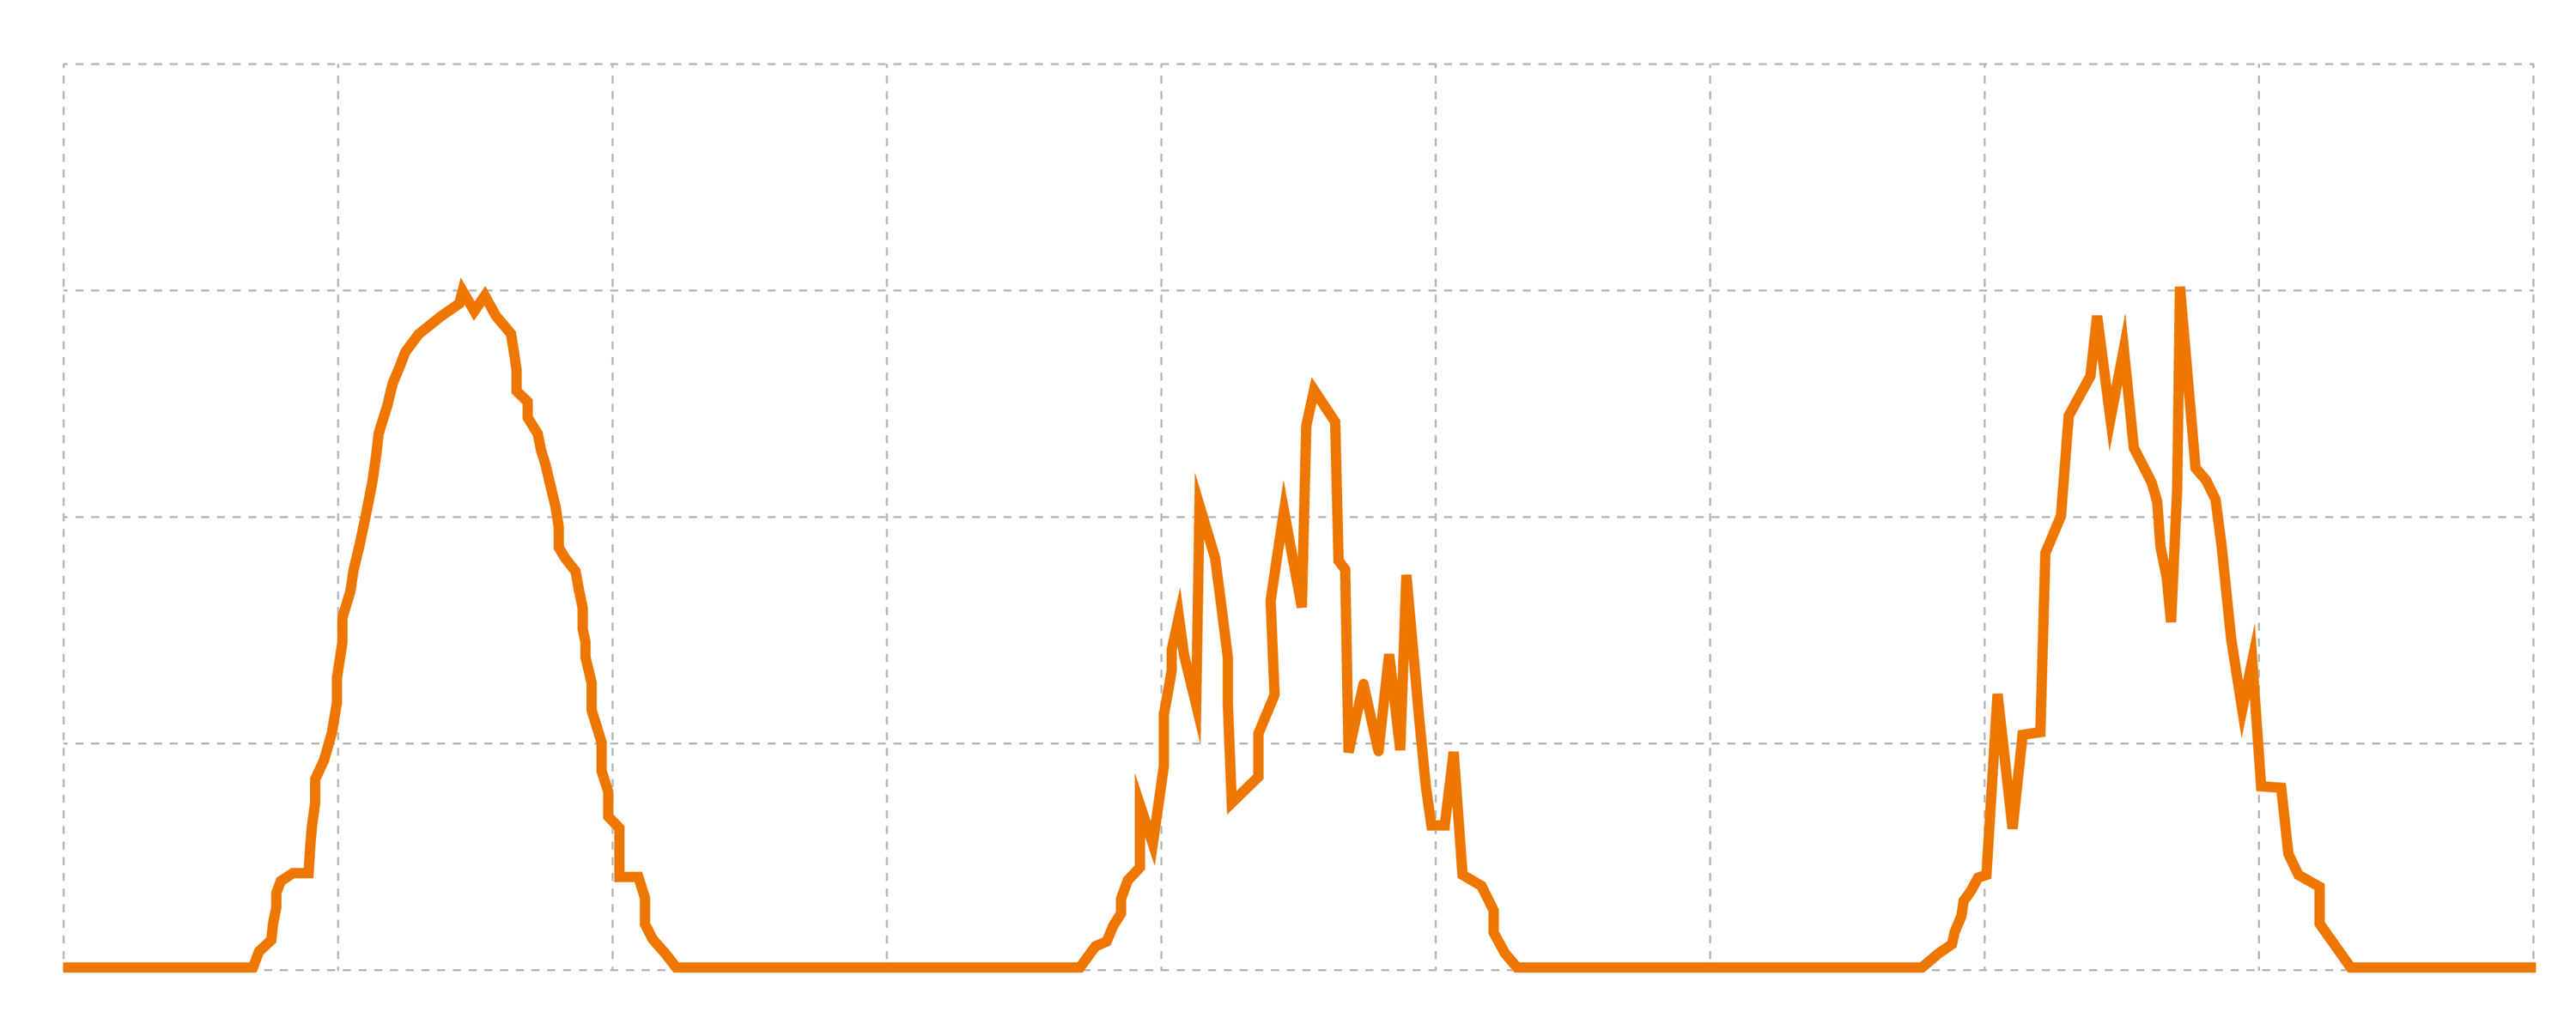
Fig. 1 Power curve of a 100MW PV plant in three days
The above fig.1 shows the power generation curve of a 100MW power plant for three days. The plant is designed with a DC/AC ratio of 1. Its power output is close to 100% at noon while not fully used for the rest of the time. Particularly, power generation fluctuates dramatically due to weather conditions.
The return on investment (ROI) will be reduced due to the low utilization of AC equipment, like inverters and transformers, caused by the short full-load duration which increases the LCOE of the plant directly.
The power output fluctuates significantly, which makes it tougher to ensure the accuracy of PV power output prediction and the grid operation and dispatching schedule. The project owners are likely to be penalized due to inaccurate power predictions.
Increasing the DC/AC ratio for an optimized LCOE

Fig. 2 Power curve of a 200MW PV plant in three days
Above the fig.2 shows the power generation curve of a 200MW power plant for three days. Given a DC/AC ratio of 1.42 and the tracking system, the inverter can be operating at full power from 8 AM to 5 PM. In such scenario, the curve tends to be a square wave, even if the solar irradiation fluctuates, which means the output power of the inverter is delivered with minor changes, and the power generation of the plant is more stable, as a result.
The LCOE is optimized with increased yield, though there exists solar energy curtailment, which makes the project more profitable. Additionally, the power generation curve which is no longer fluctuating shows a smoother and more dispatchable power output, significantly improving the stability of the grid. Notably, the inverter from Sungrow is equipped with reactive power function without excessive equipment, enabling improved power system stability, reduced energy losses and complying with most demanding local power quality standards and grid codes, saving investment at large.
Solar-plus-storage solutions towards 24 hours of continuous power yields

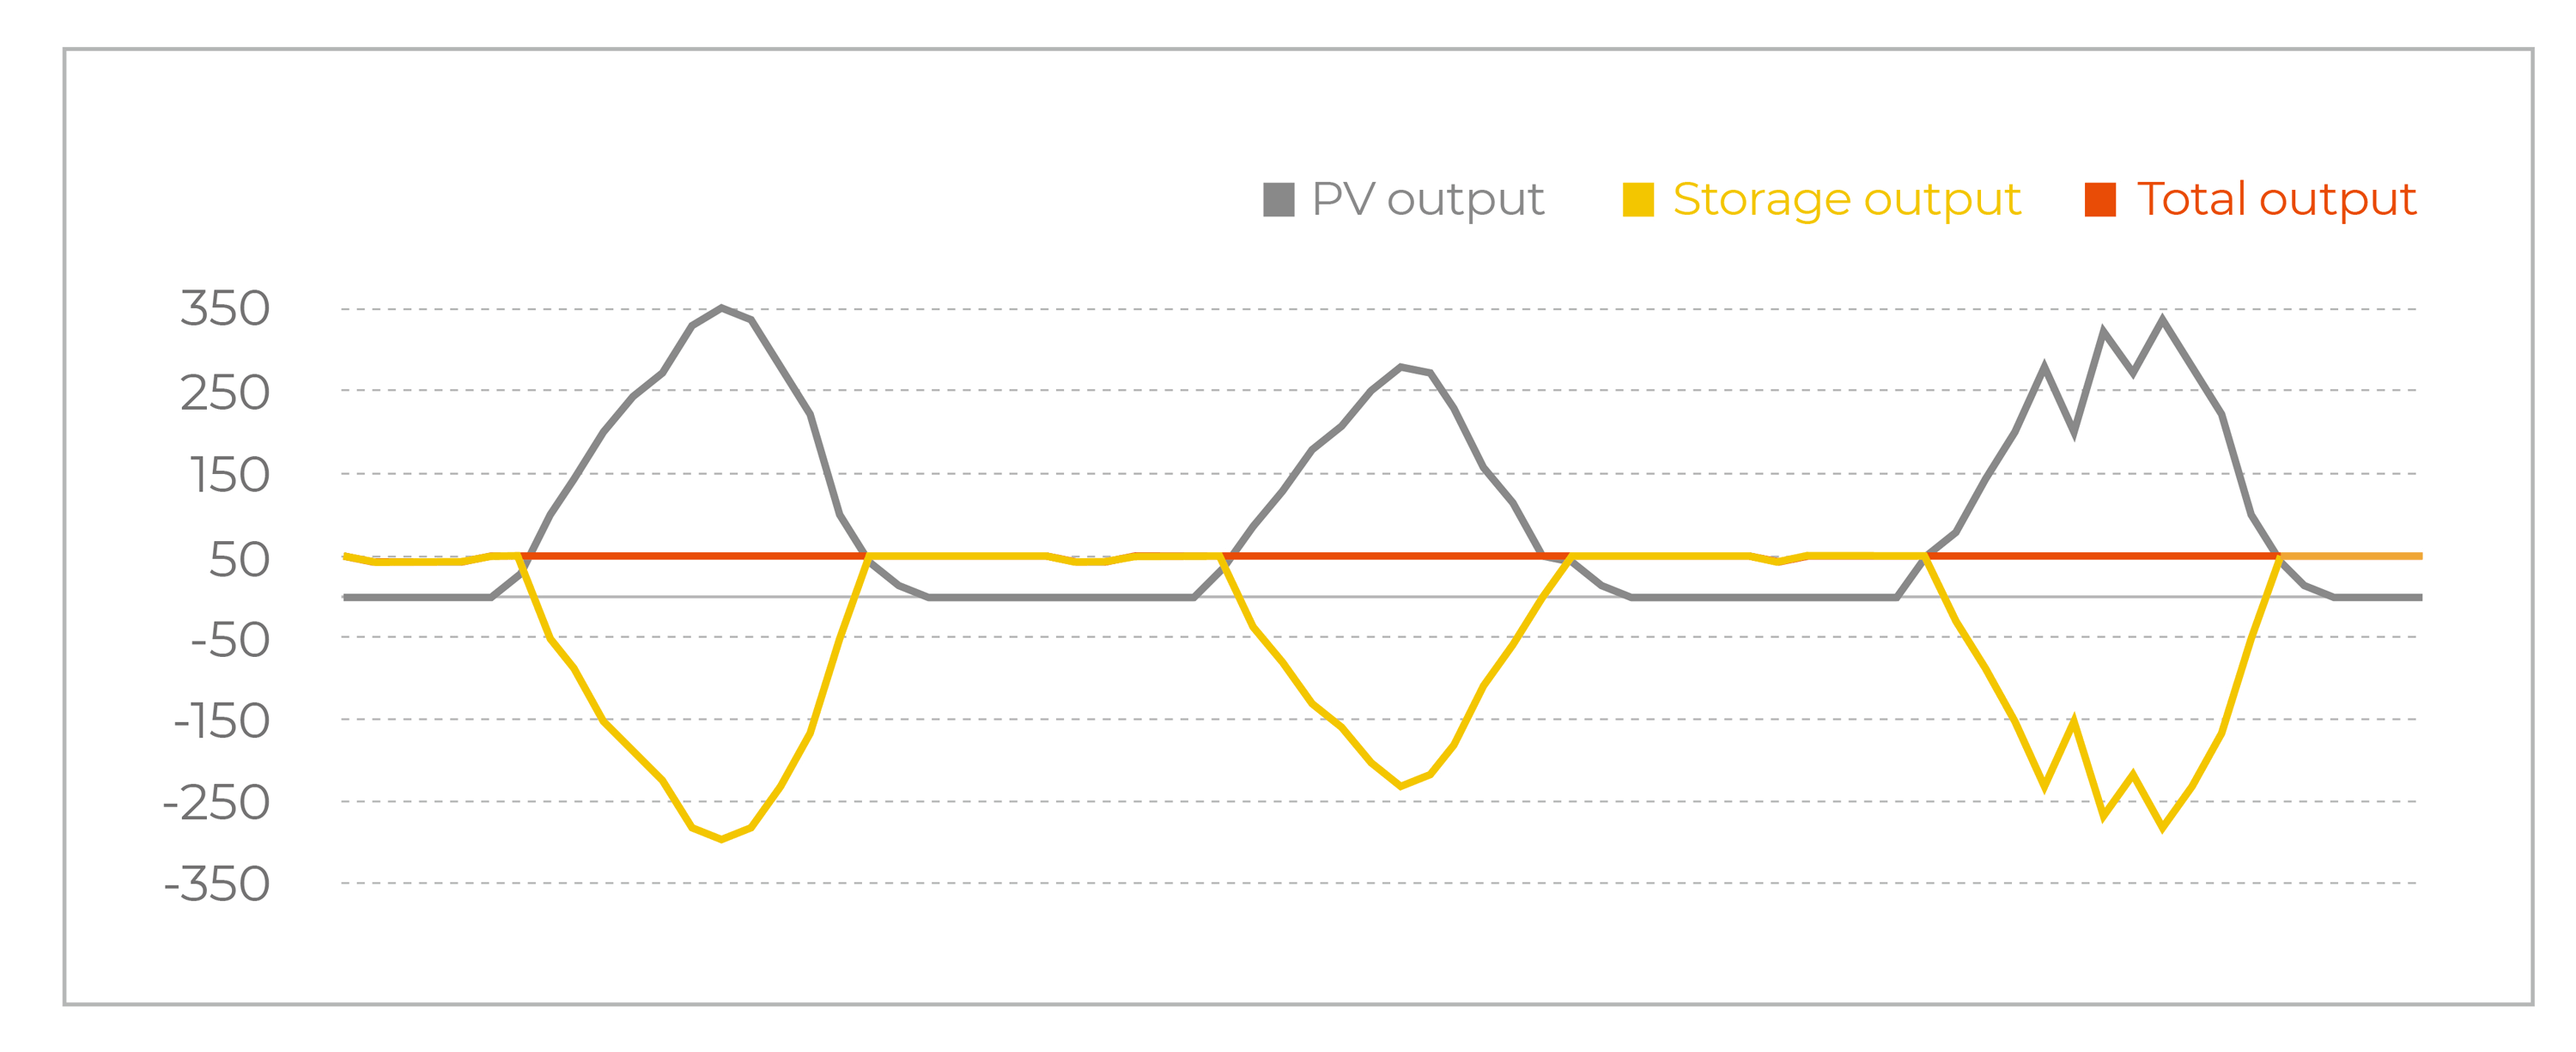
Fig. 3 Power curve of a solar-plus-storage project in three days
The Fig. 3 illustrates the power generation curve of a solar-plus-storage project for three days. The plant adopts a striking DC/AC ratio of 7 and a DC-coupled system, guaranteeing 24 hours of continuous power yields, which completely tackles issues of PV curtailment and output power fluctuations, ensuring maximum yield and grid reliability.

Fig. 4 Pathway of PV development
The above three power generation curves imply three periods of PV power generation, evolving from maximizing power generation without considering the grid stability, increasing the DC/AC ratio for an optimized LCOE, to 24 hours of continuous power yields utilizing solar-plus-storage solutions.
Challenges are still there in some markets, as uncertainty over future investment policies and increasing competition from other alternative fuel sources, infrastructure and administrative processes that need to be addressed to fully take advantage of regional solar energy potential. Most countries are in the second period while we see a massive wave of PV plants head towards the third period given the feed-in tariff, government support and investment across the value chain, as well as proliferating power demand.
Apparently, the solar-plus-storage solutions for 24 hours of continuous power yields not only benefits the stakeholders with considerable ROI, but also makes the renewable energy accessible day and night, which facilitates the leap of solar energy deployment and drives to a sustainable and prosperous future.